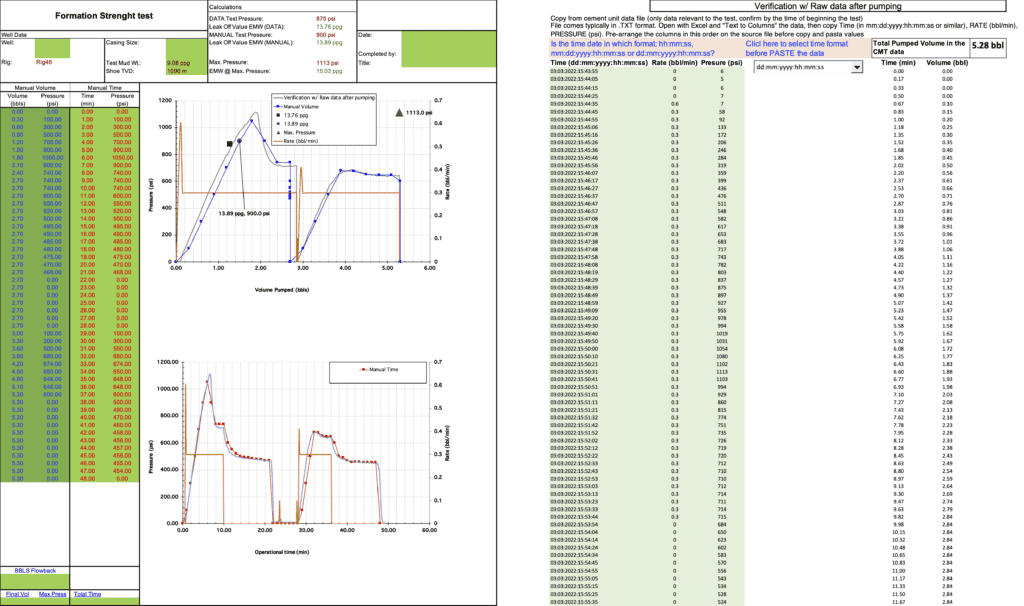
Sheet to support Formation Strength Test (Leak off, FIT, SBT) and Pressure Vs Volume Chart
Enter all the header information for the well, rig, casing size, shoe depth, mud weight,
date and your name at the top of the form on the “CHART” worksheet.
- Begin by circulating and conditioning the mud until the shaker is clear of cuttings, maintaining mud weight within +/- 0.1 ppg of the desired level for consistent measurements.
- Rig up, conduct a pressure test, and thoroughly check for any leaks.
- Proceed with pumping down the drill pipe, pausing circulation with the cementing unit or a low vol/high press pump.
- Close either the annular BOP or pipe rams to secure the operation.
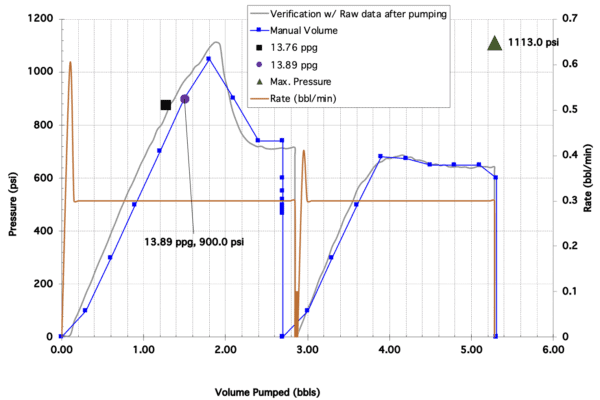
- Maintain a steady pumping rate down the drill pipe, aiming for 1/4 bpm initially (matching the casing test rate). Document pressure readings at each 1/4 bbl. interval and chart them on the “CHART” worksheet’s MANUAL VOLUME section. This real-time task requires coordinated teamwork for accuracy.
- Remember to have a team member simultaneously record casing pressure from the choke manifold at the same 1/4 bbl. intervals. If variations of over 10% from the drill pipe pressures are noted, promptly communicate this to the office for further action.
- Continue the operation until leak off is detected. This is indicated by a change in the rate of pressure increase, as observed in the leak off test chart. Pump at a constant rate to confirm the leak off indications. If the pressure resumes a constant rate of increase, continue pumping and monitor for subsequent leak off indications. Stop pumping immediately if the rate of pressure increase declines or a sudden pressure drop occurs.
- Record the Instantaneous Shut-In Pressure (ISIP) and monitor it for at least 10 minutes.
- Release the pressure and record the volume of fluid recovered during flow back.
- If the measured leak off pressure is lower than the predicted value, there might be a cement channel present. In such cases, consider repeating the Leak Off Test (LOT) for confirmation. If a cement channel exists, there should be minimal to no improvement observed.
- Collect data from the cement unit at the conclusion of the test. Typically, this data is stored in a text file.
- Open in Excel directly or using “Text to Column” bottom. Cut and insert the Rate (bbl./min) column, after the time, follow by the Pressure (psi) column. Same order indicated staring in Column P of the “CHART” Worksheet
- Copy and paste the FIRST (03) three column form the CEMENT UNIT data – Time / Rate (bbl./min) / Pressure (psi)
- Select the correct time format
- The CMT UNIT data is plotted in the Volume and Time chart. Over the exiting MANUAL data. The Leak off value is recalculated using this data and a 2nd market will appear on the chart. The value will appear on Leak Off Value EMW (DATA) cell
- If two cycles are done, the leak off will appear on the chart and a value will be calculated for the 1st cycle only. You can create a new file only for the 2nd cycle, to get the 2nd cycle leak off value, if required
- For an FIT only the Max pressure will appear

Leave a Reply