Pressure analysis of a 9 5/8” casing cementing operation.
Information gathering for cement evaluation starts with the basic details of the job design, including casings information, wellbore details, formation and temperature pressures.
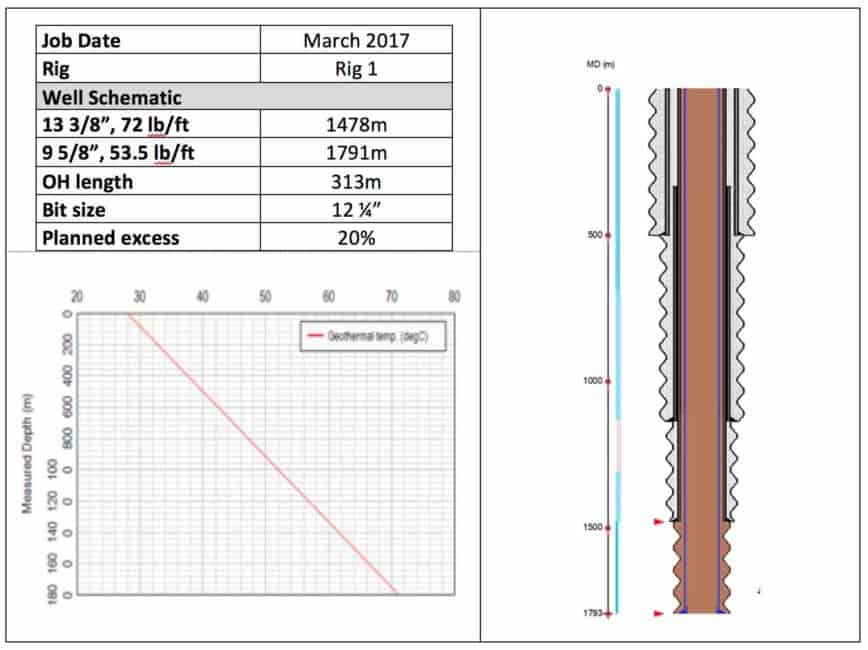
Proper post-job analysis continues with kind of an investigation process where key information is gathered from job reports from different sources, including cement job reports, DDR, DMR, mud logging, time log, etc.
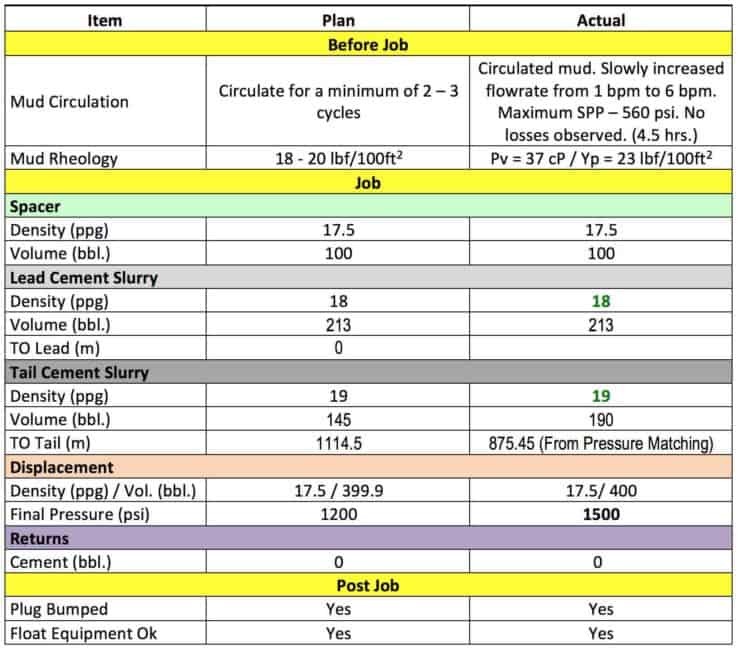
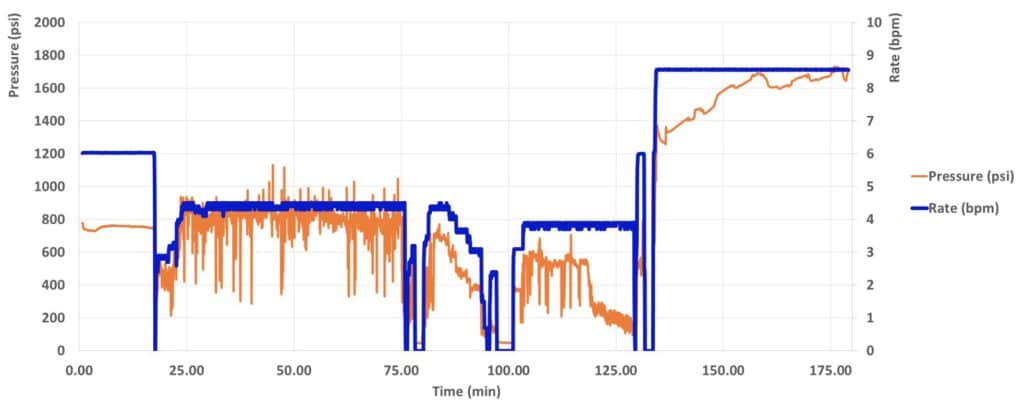
During the information-gathering phase of the cement evaluation, pumping data is retrieved from the cementing contractor in tabular form, including pressure, rate and the pumped fluid downhole density, normally, every 1 – 5 seconds.
This data is used to calibrate a model in computer simulation with the actual pumping pressure used as reference or comparison against a calculated pressure value using actual rate and density values; in conjunction with all other inputs from well schematic, details, fluids rheology, etc., as reported instead of the originally designed values. For example mud rheology from the DMR the day of the job, shoe depth from the DDR, etc.
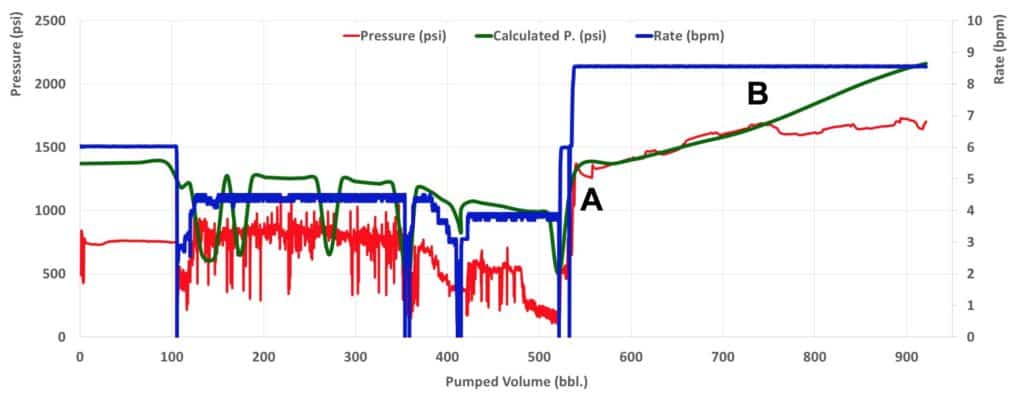
The most important part of the pressure comparison process for the purpose of calibrating the model is the part that starts from point A where the cement slurry being the heaviest fluid turns around the shoe and starts its way up in the annulus producing a progressive pressure increase linked to pumping rate and annular capacity.
Before point A; the pumping pressure, while all cementing fluids have not reached the shoe, sometimes the actual pressure appears higher or lower than the calculated value by a constant factor which is sometimes resulting from under or overestimated surface friction pressure.
In this curve for example:
Due the use of bottom plug both (mechanical barrier between lead cement slurry and spacer or mud preventing intermixing inside the casing) measured and calculated pressure curves depart at the same pumped volume (point A). This is an indication of no fluid intermixing inside the casing;- Measured and calculated pressure curve raise during the displacement with
same slope from A to B. In B, the measured pressure remains more or less at the same value indicating possible losses. The volume of losses can be estimated directly from pumped volume since the actual pressure remains flat which is a sign of total losses. If on the contrary, the actual pressure continues increasing, but at a lower rate (curve slope) indicating partial losses, the volume of losses can be estimated from the difference between the slopes of the curves (actual and calculated curves).
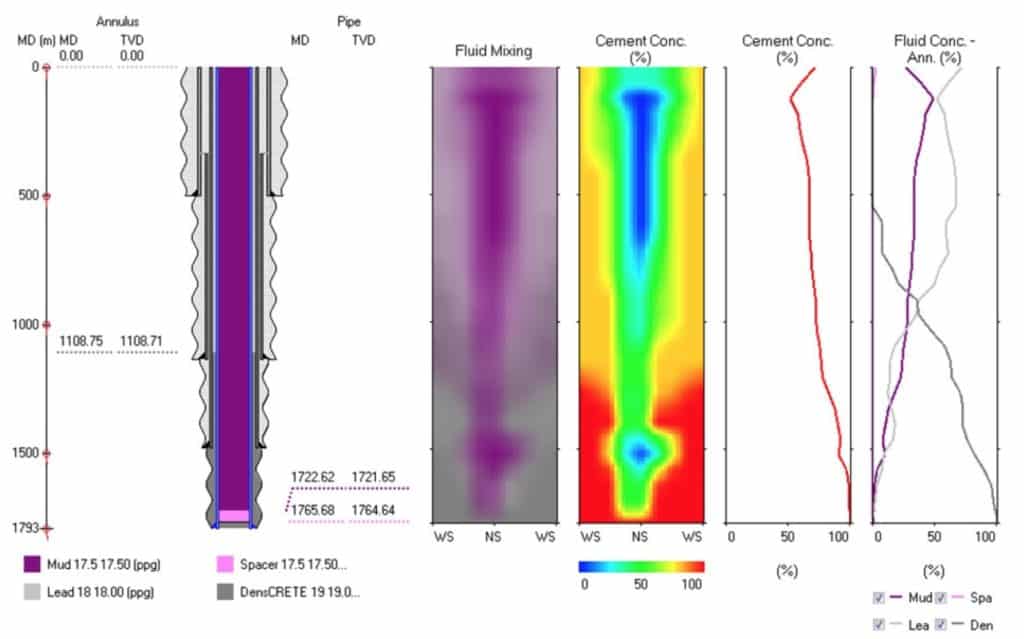
When the model is calibrated and the pressure comparison process is completed, the output of the cement coverage (displacement efficiency in CemPRO+) is considered sufficiently valid to explain the cement presence in the annulus or to graphically correlate with any available circumferential cement log.
The difference between measured and actual pressures and discrepancies between cement coverage and cement evaluation logs should be explained by the cement engineer and ultimately converted to recommendations and actions to be put in place in any future similar cement job to produce improved results and maximize success in terms of zonal isolation and other relevant job objectives.
Post-job evaluation is a
“Those who
Cheers,
L. Diaz

Leave a Reply